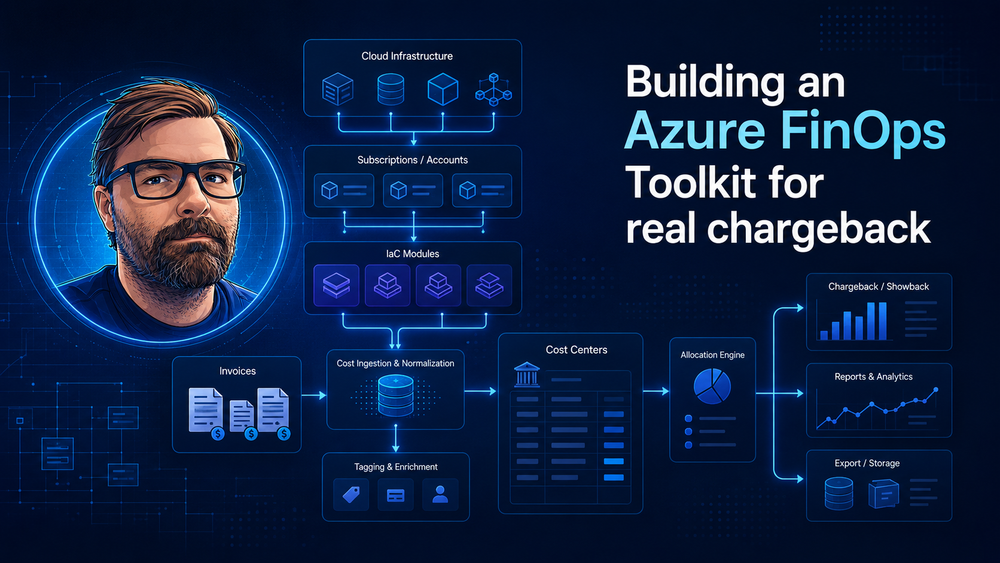
Building an Azure FinOps Toolkit for real chargeback
Azure cost reporting is easy until somebody asks the awkward question: "Which cost center should pay this invoice?"
The Azure portal can show spend by subscription, resource group, tag, meter and service. That is useful, but it is not a chargeback model. Chargeback needs ownership rules, allocation logic, invoice reconciliation and a boring audit trail. If those rules live in a spreadsheet that only one person understands, the process will break as soon as the environment grows.
This is the idea behind the Azure FinOps Toolkit I started here:
https://github.com/SBajonczak/AzureFinopsToolkit
The repository is meant to become a practical starter kit: Terraform templates for the Azure foundation, tagging guardrails, Cost Management exports and a small report generator that can compare Azure usage data with reseller or third-party invoice rows.
The problem: Azure cost is not always the invoice
In a direct Azure contract, the Azure Cost Management export is often close enough to the invoice for internal reporting. In indirect reseller or CSP setups, the invoice can include additional lines: reseller fees, marketplace products, corrections, discounts, support items or bundled services.
That means a useful FinOps report has to answer four questions:
- Which Azure resources created the cost?
- Which system or team owns those resources?
- Which cost center should receive the charge?
- Where does the reseller invoice differ from the Azure export?
If you skip the fourth question, finance will still need a manual reconciliation step. That is where hidden Excel logic starts to creep in.
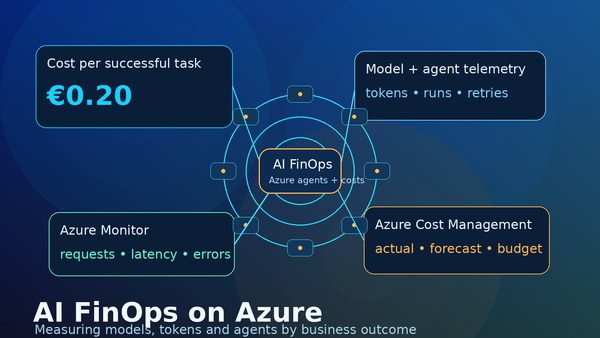
The architecture
The toolkit uses Azure Cost Management exports as the raw source, then enriches the data with tags and mapping rules.
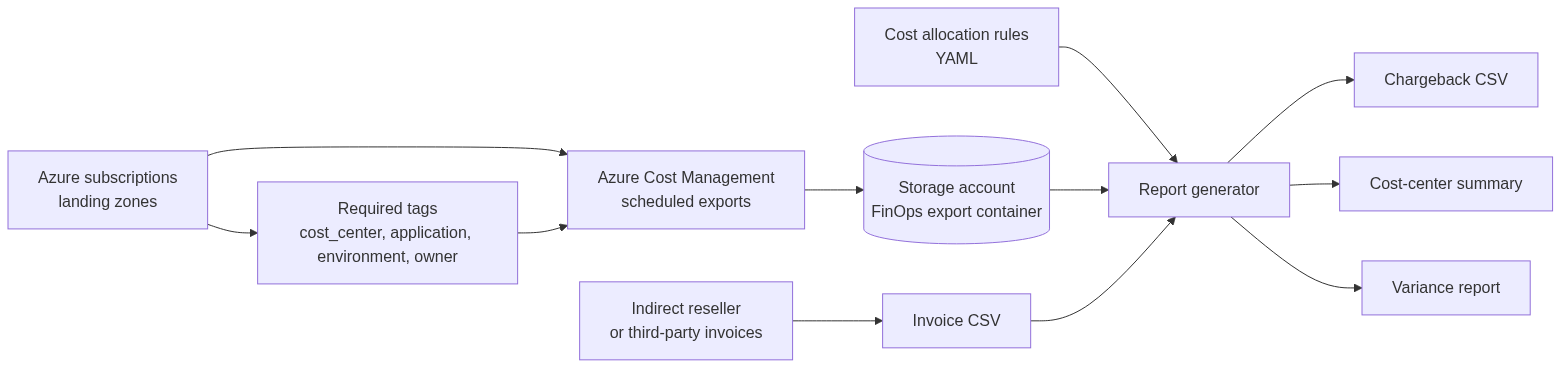
There are two layers:
- Terraform creates the foundation: export storage, Cost Management exports, tag policies and budgets.
- The reporting script reads exported usage, reseller invoice rows and allocation mappings, then writes CSV reports for finance and operations.
I like this split because Terraform is good at making the Azure side repeatable, while a reporting script is easier to test and evolve than a pile of portal filters.
Landing zones are part of the cost model
A landing zone is not only an architecture topic. It shapes how cost can be explained later.
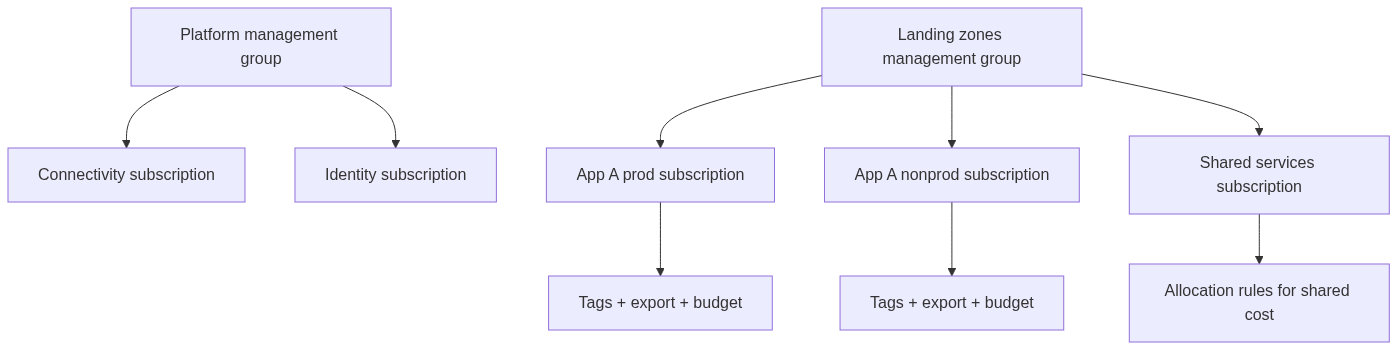
Subscriptions are useful boundaries when ownership, budget, compliance or RBAC differ. Tags are useful for dimensions inside that boundary: application, environment, owner and cost center.
My rule of thumb: use subscriptions for control-plane boundaries, use tags for reporting dimensions. Do not ask tags to do the job of a landing zone.
The minimum tag contract
The first Terraform module creates an Azure Policy initiative for required tags:
module "required_tag_policy" {
  source = "../../modules/tag-policy"

  policy_assignment_scope = var.policy_assignment_scope
  required_tags           = ["cost_center", "application", "environment", "owner"]
  effect                  = "Audit"
}
I would start with Audit, especially in existing environments. Going straight to Deny looks clean on paper and creates pain in real life. Once teams understand the model and deployment pipelines add the tags automatically, moving selected scopes to Deny is reasonable.
The default tag set is intentionally small:
| Tag | Example | Why it matters |
|---|---|---|
cost_center |
CC1001 |
finance owner |
application |
payments-api |
system or product owner |
environment |
prod |
prod/nonprod split |
owner |
team-payments |
accountable team |
You can add more later, but these four already cover most chargeback conversations.
Terraform foundation for Cost Management exports
The second module creates the export storage account and scheduled Cost Management exports.
module "finops_foundation" {
  source = "../../modules/finops-foundation"

  location             = var.location
  resource_group_name  = var.resource_group_name
  storage_account_name = var.storage_account_name
  cost_exports         = var.cost_exports
  budgets              = var.budgets

  tags = {
    cost_center = "FINOPS"
    application = "azure-finops-toolkit"
    environment = "prod"
    owner       = "platform-team"
  }
}
A subscription export definition looks like this:
cost_exports = {
  app_prod = {
    scope                   = "/subscriptions/00000000-0000-0000-0000-000000000001"
    recurrence_period_start = "2026-01-01T00:00:00Z"
    export_path             = "app-prod"
  }
}
Budgets can be added with tag filters:
budgets = {
  cc1001_prod = {
    scope          = "/subscriptions/00000000-0000-0000-0000-000000000001"
    amount         = 2500
    start_date     = "2026-01-01T00:00:00Z"
    contact_emails = ["finops@example.com"]
    filters = {
      tag_name   = "cost_center"
      tag_values = ["CC1001"]
    }
  }
}
This does not magically solve FinOps, but it gives you a repeatable reporting substrate. Every subscription that should participate in chargeback gets an export and the same tag policy.
Allocation rules for shared services
Direct resource cost is easy: read the cost_center tag and charge the amount there.
Shared services need rules. A hub network, central firewall, monitoring workspace or backup vault may serve multiple teams. The toolkit keeps that logic in YAML:
shared_services:
  shared-connectivity:
    allocation_method: percentage
    allocations:
      CC1001: 0.45
      CC1002: 0.35
      CC2001: 0.20
A cost row tagged with cost_center=shared-connectivity is split across the target cost centers. The report keeps the original amount and the allocation rule, so the split is auditable.
This is deliberately simple. Start with percentages if you have no better driver. Later you can replace them with user count, transaction volume, bandwidth or another metric that better reflects consumption.
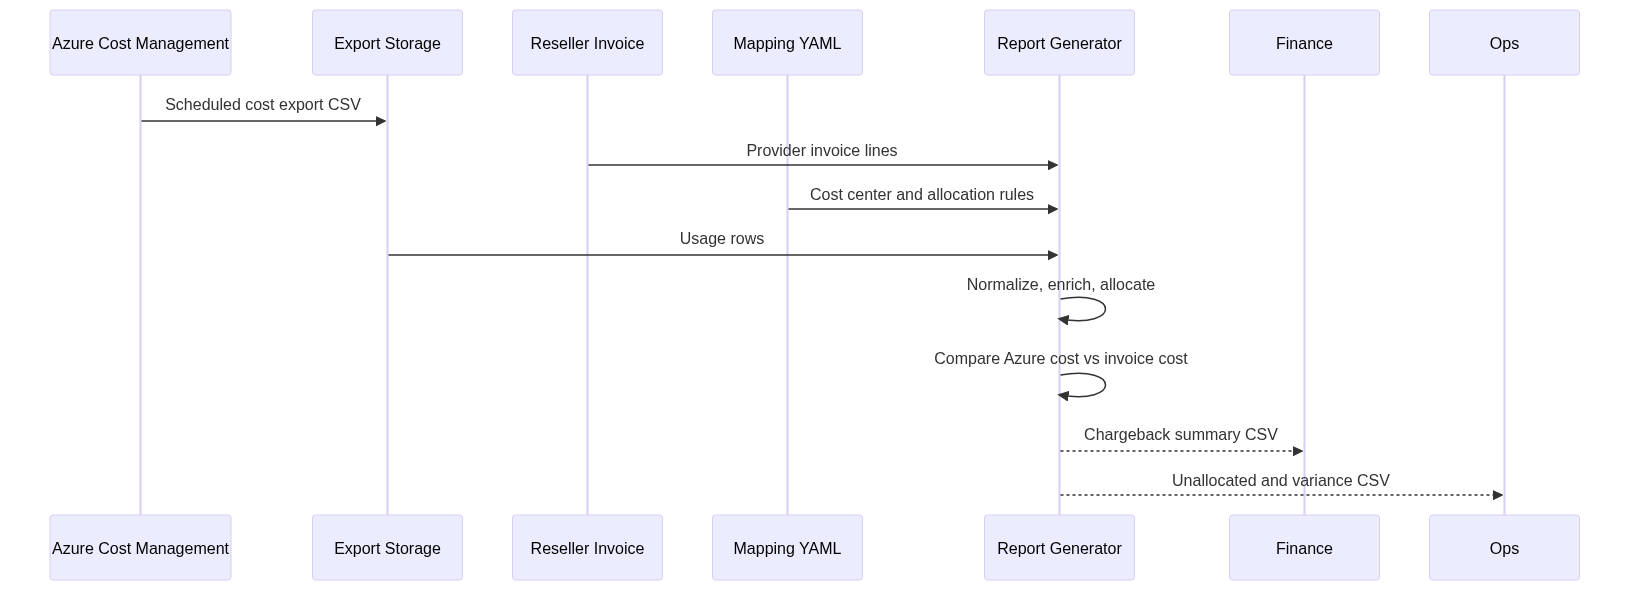
Invoice reconciliation
The reporting script accepts Azure export CSV files and optional reseller invoice CSV files:
python3 scripts/generate_chargeback_report.py \
  --cost-export ./exports/2026-05/*.csv \
  --invoice ./invoices/reseller-may.csv \
  --mapping ./mappings/cost-centers.yaml \
  --output-dir ./reports/2026-05
It writes four reports:
| Report | Purpose |
|---|---|
chargeback-detailed.csv |
row-level allocation for finance review |
chargeback-summary.csv |
monthly total by cost center, application, environment and source |
variance-report.csv |
comparison between Azure export amount and invoice amount |
unallocated-costs.csv |
missing tag or missing mapping backlog |
The variance report is the important one when a reseller sits between you and Microsoft:
subscription_id,azure_export_amount,invoice_amount,variance
00000000-0000-0000-0000-000000000001,348.70,360.00,11.30
00000000-0000-0000-0000-000000000002,80.00,54.50,-25.50
A variance is not automatically bad. It can be a fee, discount, tax-related difference, marketplace charge or timing difference. The point is that it becomes visible and reviewable.
What this gives you
A useful Azure FinOps setup is not a dashboard. It is a small system:
The Terraform code makes the reporting inputs predictable. The script makes allocation explicit. The output gives finance a chargeback file and gives operations a backlog of missing metadata.
That last part matters. FinOps should not only explain last month. It should improve next month. Every missing tag in unallocated-costs.csv is a concrete fix, not a vague governance complaint.
Where I would take this next
The first version is intentionally plain: Terraform plus CSV. That makes it easy to run in a pipeline and easy for finance to inspect.
The next useful additions would be:
- GitHub Actions to run monthly report generation.
- Optional upload to a data lake or Fabric workspace.
- More allocation methods for shared services.
- Support for reservations and savings plan normalization.
- A Power BI model on top of the generated CSVs.
- Stronger Terraform examples for management-group scoped landing zones.
The boring version is the right starting point. Get the exports right, make ownership mandatory, reconcile the invoice and keep every allocation rule in source control. Once that works, dashboards are the easy part.