Unlocking Project Insights: The Power of Sprint Burn Down Charts
In many project there is the one thing of truth. The sprint burn down. It will face the team about the progress of the sprint. Also the efficiency of them and also it tells you if the sprint will a success.
But that's not a tool only for a project manager or a scrum master to see the progress of the sprint. On the other side there are developers and there are mostly tools to get a good discussion point on how it get so worse for the sprint.
The basic
The basic of a sprint burn down it the following diagram
In whit you see the Y-Axis that interprete the Amount of Work, The horizontal axis will represent the time. So in this sprint there are only 20 days planned with an effort of 60 (storypoints).
the next line are the red line, this line is the idealtrend that will show you the flow of the work. Then there is the blue line, this is the real trend and indicates the progress of the team. So the goal is to get under this line.
That is the basic definition of the sprint burndown.
Using Burndown as tool
I will now show you some burndown as example and describe the analysis for this
Example 1 (Overlading the Sprint)
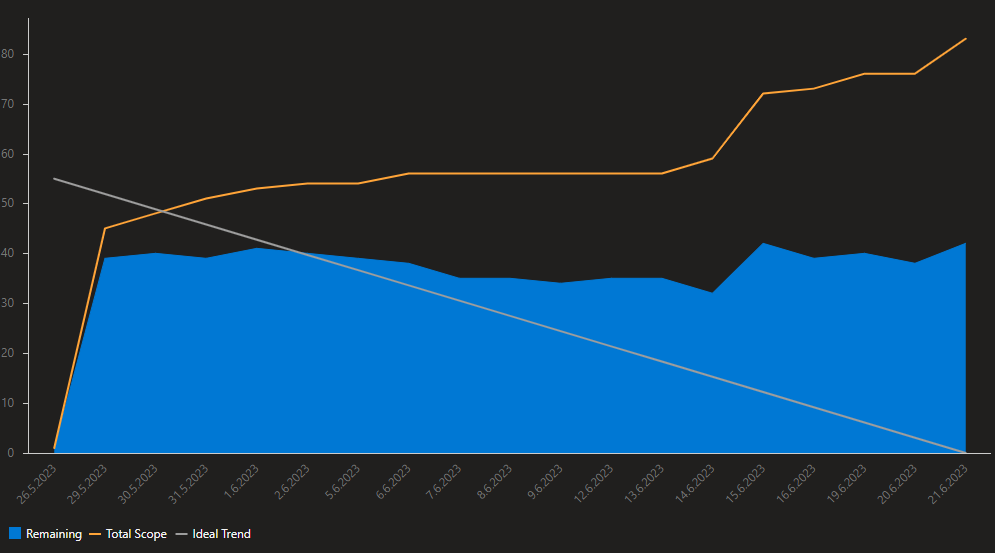
In this example you will see the construct of a burndown with the grey ideal trend, but the blue area (remaining work) won't follow the line.
When we deep dive into the sprint and look at the amout of ticket and display it as a line into the diagram (yellow line) You will see that there are added more Workitems as planned.
Solution
So in this situation the sprint will be overloaded with new tickets / tasks. But this will have a huhge affect to the sprint. Beaucse they are
- Not estimated
- Not well known
- Not planned
So in this fact the solution is to exclude planned tickets with the same amount
Example 2 (Sprint with more capacity)
Let's look at this example from the internet
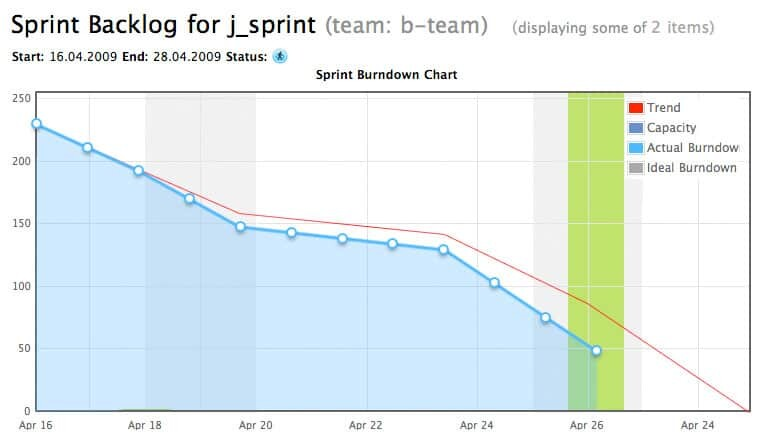
You see that the actual burndown now is every time under the ideal trend. This is a very good burndown, so in most cases, you must not do anything, so the team is well suited and work efficiently at the task. So for some reason, the burndown will fall lower as expected. This will result in the team finishing its work days before the sprint ends.
You can now do the following
- Let them do it, and give them a day off in the theme park ;)
- Speak with them and let they do any extra task that suits the sprint
Sure you can now think about the estimation, but this is only the case when you have this situation multiple times. But for this example, we assume that it is a one-time situation.
Solution
As described before, you now be able to control the team to get more work. Put some new tasks in the sprint. But be sure, don't do this without the acknowledgment of the team, because they promised that they get ready in the sprint.
Conclusion
In conclusion, the sprint burn down chart is a valuable tool that provides insights into the progress and efficiency of a sprint. It serves as a common reference point for the entire team, including project managers, Scrum Masters, and developers. The chart visually represents the amount of work remaining over time, with the ideal trend indicating the desired progress and the real trend showing the actual progress.
Analyzing the sprint burn down chart can reveal important information about the sprint. In Example 1, an overloaded sprint is depicted, where additional work items were added without proper estimation, planning, or knowledge. The solution in such cases would be to exclude some planned tickets or tasks to prevent a negative impact on the sprint.
In Example 2, a sprint with more capacity is illustrated, where the actual burndown consistently falls below the ideal trend. This indicates that the team is working efficiently and may finish their tasks before the sprint ends. In this situation, options include allowing the team to finish early and rewarding them or discussing the possibility of taking on additional tasks with the team's agreement.
Ultimately, the sprint burn down chart is useful for tracking progress, identifying issues, and making informed decisions to ensure successful sprint execution. It fosters transparency and collaboration within the team, empowering them to adapt and optimize their work as necessary.