SharePoint Server Log collection with Grafana Loki
Let me introduce you to the problem of collecting logs from SharePoint, especially on a SharePoint farm. You got (hopefully) a correlation id, then you try to collect the logs via PowerShell, when not possible, you will go through each server and search the log for it.
Therefore you must have access to the server or the share and many many obstacles later, you can investigate the occurred problems.
So I searched the web for a solution and I end up with a nice handy tool called vector.
For collecting logs at a centralized location, I use Grafana Loki.
What is Vector
Vector is an open-source, high-performance, and observability data pipeline that allows you to collect, transform, and route logs, metrics, and other observability data in real-time. It is designed to be lightweight, flexible, and easy to use, and can be easily deployed in a variety of environments, including cloud-based and on-premise.
Vector supports a wide range of data sources and destinations, including popular logging and metrics platforms such as Elasticsearch, AWS CloudWatch, and Prometheus. It also includes a powerful transformation engine that allows you to manipulate and enrich data as it flows through the pipeline.
With Vector, you can collect and analyze data from different sources in a single platform, allowing you to gain insights and make informed decisions about your infrastructure and applications. Additionally, Vector offers a modern, intuitive user interface and a comprehensive set of documentation and community resources to help you get started quickly and easily.
What is Grafana Loki
Grafana Loki is a log aggregation system that is designed to be highly efficient, scalable, and cost-effective. It is a part of the Grafana Labs ecosystem, which includes other popular open-source tools such as Grafana, Prometheus, and Tempo.
Loki allows you to collect, store, and query logs from different sources such as applications, servers, and containers. Unlike traditional log aggregation systems that rely on indexing and searching logs, Loki uses a unique approach called label-based indexing, which allows it to store and retrieve logs based on their metadata.
With Loki, you can easily search and filter logs using standard query language and visualize log data in real-time using Grafana. Additionally, Loki supports multiple ingestion protocols such as syslog, JSON, and GELF, making it compatible with a wide range of logging tools.
One of the major advantages of Loki is its ability to scale horizontally without requiring any complex infrastructure. Loki can be easily deployed in a Kubernetes cluster and can automatically scale up or down based on the volume of logs.
Overall, Grafana Loki is a powerful and flexible log aggregation system that offers an alternative to traditional log management tools. It is highly optimized for cloud-native environments and is well-suited for organizations that need to collect, store, and analyze large volumes of log data in a cost-effective manner.
How Vector works
Vector works by providing a pipeline for collecting, transforming, and routing observability data in real-time. It consists of three main components: sources, processors, and sinks.
Sources are the entry points for data into the pipeline. Vector supports a wide range of sources, including log files, metrics, and event streams from cloud platforms and other data sources. Once data is ingested into Vector, it is passed through a series of processors.
Processors are responsible for manipulating and enriching data as it flows through the pipeline. Vector includes a powerful transformation engine that allows you to modify data in real-time using a wide range of functions and operators.
Finally, data is sent to sinks, which are responsible for storing or forwarding data to other systems or services. Vector supports a variety of sinks, including popular logging and metrics platforms such as Elasticsearch, AWS CloudWatch, and Prometheus.
Getting the data from the File
The first action in the pipeline is to gather the data from the file log, here I use a source reader to type file. This will take the desired path to watch and also a configuration parameter ignore_older that will control the ignored timeframe. So in my example here I will look for a file in C:\Logs\WIN-4TP4OVUIPL6 and ignore files that are older than one day.
Remapping the Data
Due to the fact, that Sharepoint will log as tab spaces log into the file, we must go further and convert the logs into a JSON variant. Thankfully vector has a transformation tool called remap with VRL. This will use the Vector Remap Language (VRL).
We get input like this
So I will parse the line with a regex value (sorry for my novice regex talents ;)). Then I will use the extracted groups to assign a new value, like correlation to the JSON. To add a new value to the output JSON, you will be able to enter a dot "." and after this the value name. For example to create a new value called output with the value "Testvalue" you can then write it like .output="TestValue".
So in my case, I use the following Remap definition.
So we take the incoming message and parse it with regex. After this, I will add new information like correlation simply to the response.
Please pay attention to the "inputs" configuration. In this, you will tell the runtime that you will take the uls source defined above.
Configuration to send SharePoint log to Loki
To push the Logs from SharePoint to Loki and display it in Grafana I use this configuration. My configuration looks like this
This will take the output from our previous remap action and will put this as JSON to the Loki instance. Each Loki instance requires some labels so I defined them in a separate section so that you can find them easily in your Loki instance.
Complete example
My complete example script looks like this. You will notice, that I will get some metrics too so that I later can send them maybe to a premtheus instance or s.th. else
The results
So let them run some time and vector will then push it automatically to loki. TO get the data from your instance, you cann select the given labels. In my example I set the source label to vector and after I filter the data to this, I will see the following result
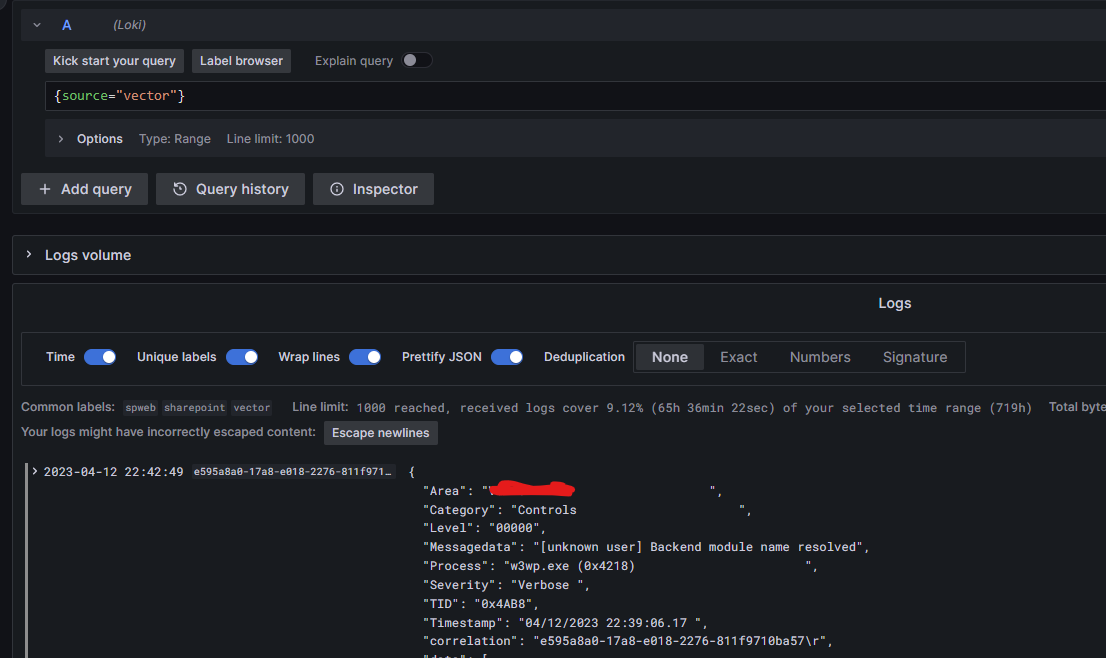
You can then now run the vector instance on each server and gather then the information from each one.
Conclusion
In this article you learned that SharePoint will write only on it's own server his log. Analyzing data get very complex, especially for a multiserver farm. To get the logs in a central location manually can get very complex. So in this case you can use vector. This article describe how to fetch the logs, then transform it and pushin this into a central loki instance. Of course this is only an example, because you can put the results into other tools.